Bridging the Data Gap: A Real-time GA4 Dashboard for Kontent.ai
Traditional monolithic CMSs show traffic stats in a sidebar. In the Headless CMS world, flexibility replaces visibility.
To address this, I created a Hybrid GA4 Dashboard for the Kontent.ai sidebar. By open-sourcing the implementation, I hope to save other developers from hitting the same technical "walls" I did.
Content editors want to focus on writing fantastic content, and for that, Kontent.ai is ideal. It empowers editors to focus completely on writing and production. But content production isn't a solo mission; it’s a team effort. Kontent.ai provides all the tools needed for collaboration, communication, suggestions, and notes, so you never have to switch between platforms. Everything stays within Kontent.ai, which in turn provides fantastic audit logs so you can always track exactly what has happened.
But once that content is published, you, as a content editor, want to see if your work is actually being read and if it’s attracting the right audience. Because Kontent.ai is a headless CMS, the common assumption is that you can't see these insights within the environment. Or can you?
We get this question regularly. In this article, I want to address this not just with theoretical solutions, but with a truly working functionality that you can deploy yourself today.
A Brief History of Measuring Success
How do we measure if content works? We’ve wanted to know this since the very first websites were built, and simple possibilities have existed from the start. However, everything changed in 2005 when Google acquired a company called Urchin. This became Google Analytics, a move that immediately took web statistics to a higher level and made them available to everyone. Even though there are many great alternatives today, Google Analytics is still considered one of the gold standards.
In this article, we will use Google Analytics 4 (GA4) as our base. However, thanks to the flexibility of Kontent.ai, it doesn’t really matter which analytics tool you prefer. As long as your tool provides an API to fetch statistics, you can apply the logic of this article to other platforms as well.
Multiple Integration Paths
There are several ways to integrate these insights into Kontent.ai. Depending on your needs, you might choose:
Custom Elements: Best for "at-a-glance" stats in a specific tab.
Custom App (Dialog Mode): Ideal for a more detailed, focused view that pops up when requested.
Custom App (Full-screen): Perfect for a complete project-wide dashboard.
Identifying the Content: URL vs. Item ID
To fetch stats from Google, we need a way to identify the content. In this implementation, I have chosen to use the URL Path. The advantage here is that the URL is standard information, allowing you to immediately retrieve data for existing content.
However, there is a more robust approach: using the Content Item ID. While not standard in GA4, you can register this ID as a Custom Dimension. This is arguably the most accurate method because if an editor changes the URL slug, the Item ID remains the same, ensuring your data history stays perfectly intact.
The "Middleman" API
While you could theoretically call Google Analytics directly from a Custom Element, it isn't ideal. In the browser, we often don't know the final resolved URL of a content item just by looking at its elements. Furthermore, you should never expose your private Google API keys in a client-side script.
To solve this, I created a secure API endpoint (e.g., https://domain/api/get-stats).
The Request: The Custom Element sends the itemId or codename to this endpoint.
The Logic: The API resolves the correct URL, calls Google Analytics, and aggregates the data.
The Response: It returns a clean JSON object containing the slug, historical views, active users, and a direct deep-link to the GA4 report.
You have full control over what data you want to retrieve and how to visualize it in Kontent.ai, whether that's a graph or a table.
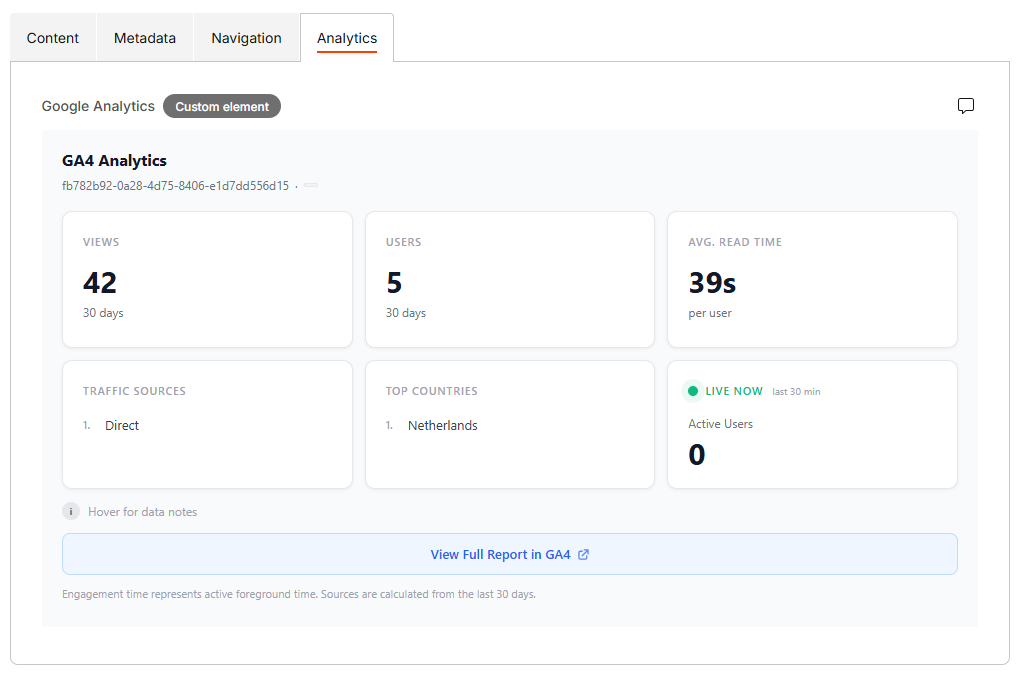
1. The Custom Element (Dedicated Tab/Content Group)
Custom element integration lives within the context of the editing screen. Critically. Editors can easily switch to this "Analytics" tab while editing. This is perfect for "at-a-glance" metrics like view counts and read time, providing instant feedback within the main editing flow.
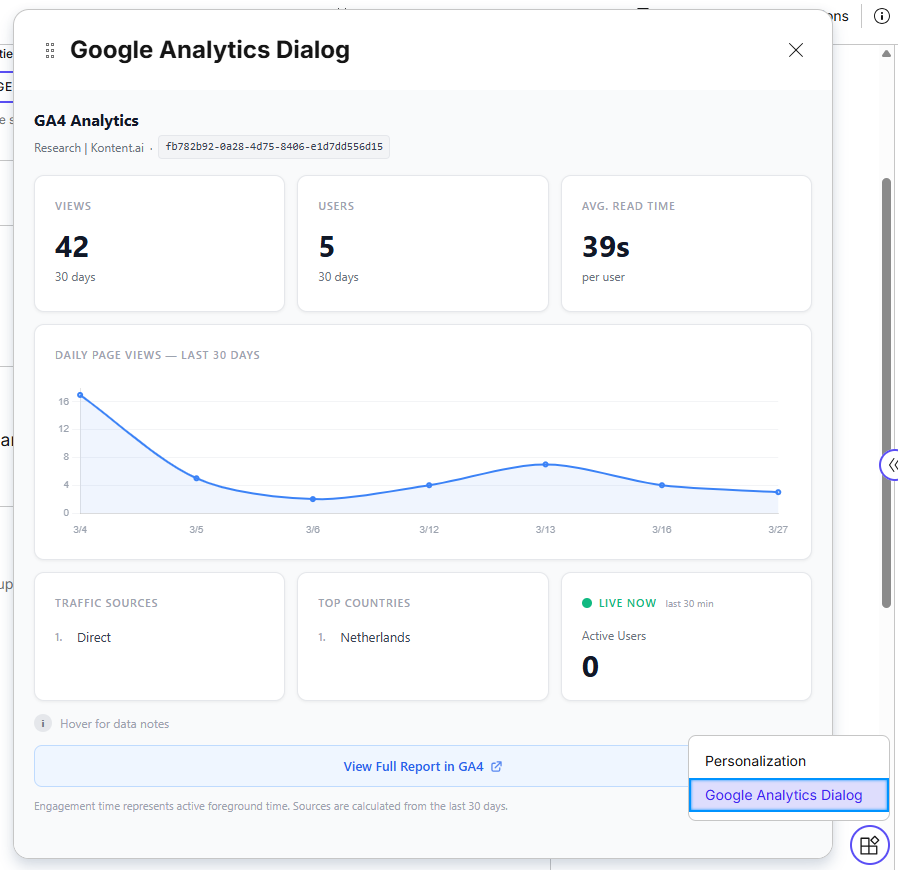
2. The Custom App (Dialog Mode Lightbox)
For a more structured presentation that goes beyond a single tab, you can use a Custom App in Dialog mode. This function acts as a Lightbox overlay. A significant advantage is that the Custom App in Dialog mode can open anywhere in the content item (e.g., via a simple button element placed next to any content field).
This gives you significantly more room to add more detailed insights, making it ideal for displaying complex line charts of daily views, geographic maps, and traffic source breakdowns that would be too cramped in a sidebar tab. The custom app provides a highly structured analysis experience embedded directly within the item.
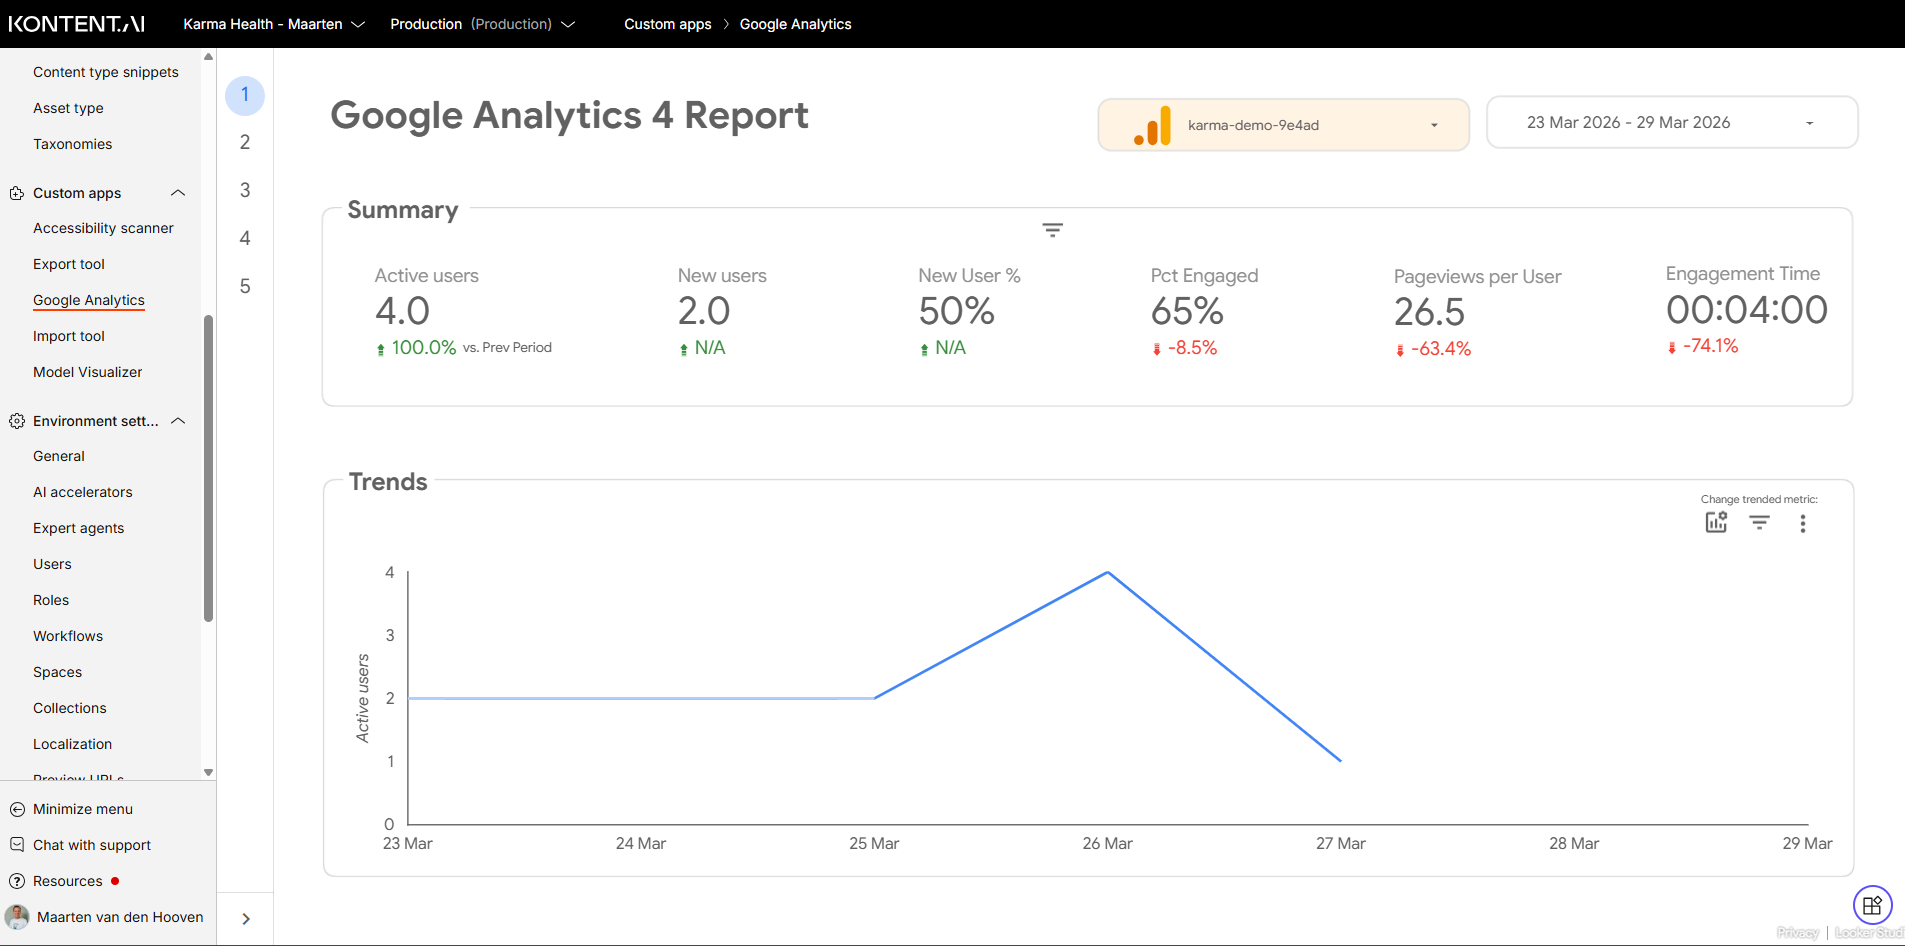
3. The Full-screen "Command Center"
Finally, you can integrate a Full-screen Custom App. This serves as a project-wide dashboard accessible directly from the main Kontent.ai navigation.
But here is the pro-tip: You can create a specialized, Custom Dashboard within Google Analytics (or Looker Studio) specifically for your content team. By taking the shared URL of that complete dashboard and embedding it as a Full-screen Custom App, you bring a professional, project-wide analytics "Command Center" right into Kontent.ai.
Conclusion: Data-Driven Editing
By bringing these insights directly into the Kontent.ai interface, we transform the editor's experience from "guessing" to "knowing." Whether you use a simple sidebar element or a full-screen dashboard, the goal remains the same: empowering your team to stay within their creative flow while making data-driven decisions.
What if we told you there was a way to make your website a place that will always be relevant, no matter the season or the year? Two words—evergreen content. What does evergreen mean in marketing, and how do you make evergreen content? Let’s dive into it.
How can you create a cohesive experience for customers no matter what channel they’re on or what device they’re using? The answer is going omnichannel.
To structure a blog post, start with a strong headline, write a clear introduction, and break content into short paragraphs. Use descriptive subheadings, add visuals, and format for easy scanning. Don’t forget about linking and filling out the metadata. Want to go into more detail? Dive into this blog.
Lucie Simonova
Subscribe to the Kontent.ai newsletter
Get the hottest updates while they’re fresh! For more industry insights, follow our LinkedIn profile.