Usage report
Each Kontent.ai subscription comes with a daily usage report, giving you an overview of your current metrics consumption and the cost of your plan.
Check your usage report
Usage reports capture your subscription usage at a point in time. They are calculated once a day around midnight.- Click your initials in the bottom left corner.
- Choose Subscriptions from the menu.
- Select your subscription.
- Choose the Usage report tab.
What’s in a usage report?
Daily usage reports provide an overview of your subscription plan cost, the cost of extra usage, and the length of your current billing period.- Active users – the number of active users in active projects that belong to the subscription.
- AI credits – the amount of credits you have in your subscription to use with the AI Agent.
- Bandwidth – the amount of data transferred through Kontent.ai API requests across all environments.
- Collections – the sum of collections used in your active projects, calculated using the environments with the largest number of collections.
- Content items (all languages) – the sum of the existing translated content items (that is, content item variants) in your active projects in all languages, calculated using the environments with the largest number of variants.
- Existing – If you can find an item within the project, it counts towards the metric. This also applies to archived content items, that is, items in the Archived workflow step.
- Translated – Consider a project with six languages, for example. If a content creator creates a new content item in English, they create an English variant of the content item. In the other five languages, the item shows as Not translated. Only the translated variants count towards the metric.
- Content types – the sum of content types in your projects, calculated using the environments with the largest number of content types.
- Active users – shows the number of active users in active projects that belong to the subscription.
- AI credits – the amount of credits you have in your subscription to use with the AI Agent.
- AI credits aren’t available in the Developer plan.
- Fair use policy
- API calls – the number of requests made to the Kontent.ai APIs. Requests for assets, for example, using a domain such as
assets-us-01.kc-usercontent.com, count only towards Bandwidth. - Asset storage – the sum of asset storage used, calculated using the environments with the largest asset library.
- Bandwidth – the amount of data transferred across projects. This includes any requests made to the Kontent.ai APIs.
- Content items – the sum of content items used in your active projects, calculated using the environments with the largest number of content items.
- API calls – the number of requests made to the Kontent.ai APIs. Requests for assets, for example, using a domain such as
How are sums across projects calculated?
The content item, content type, and collection metrics are counted across all your projects. Specifically, the usage calculation considers only the environment with the largest number of items, types, or collections. Make sure to review your usage in all of your project’s environments. For example, consider a subscription with the following projects and environments:- Project A with environments Alpha (300 content items) and Beta (400 content items)
- Project B with environments Gamma (500 content items) and Delta (140 content items)
What counts as an active user?
Users who were invited to your project and can access its content count as active users. It is the opposite of inactive users, who were disabled and cannot access the project. If you have more unique active users across your projects than what's included in the subscription plan, these users count as extra usage, show in the Extra column, and are reflected in the additional charges. The additional charges are calculated based on the maximum number of active users in the given month.Snapshots of your usage
Due to the daily nature of usage reports, any recent changes will be reflected in the next report. For example, this includes changes to your subscription or its projects, such as changing your subscription plan, inviting new users, or the amount of transferred data.Usage history
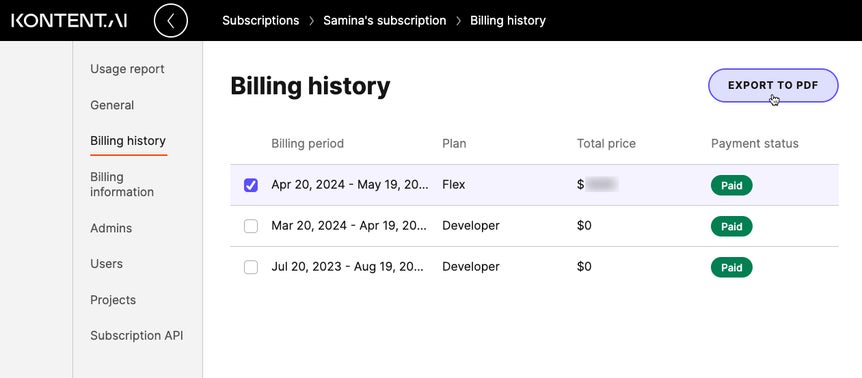
Review your usage for the past billing periods by downloading a PDF report.- On the Billing history tab, select a billing period from the table.
- Click Export to PDF in the top right.
